Forgejo Activity
A 3D contribution city where each day becomes a tower whose height tracks activity. Tracked since Jun 7, 2026.
Last updated: just now
Contribution Skyline
All times US Central
Contributions Today
0
Total Contributions
181
Current Streak
0 days
Longest Streak
4 days
Record Day
34 contributions
Last 7 Days vs Prior 7
↑ 76%
Monthly Totals
2026-06
56
2026-07
45
2026-08
50
2026-09
30
Weekday Averages
Personal Records
Best Week34 (2026-07-13)
Best Month56 (2026-06)
Longest Gap28 days
Consistency
23%
30 days
18%
90 days
18%
365 days
30 / 90 / 365
Milestones
Next Milestone250
Projected2026-10-04
90-Day Trend
Activity Punch Card
Punch card peak at Fri 1 AM with 15 contributions (owner time).
0
2
4
6
8
10
12
14
16
18
20
22
Sun
Mon
Tue
Wed
Thu
Fri
Sat
Hourly Rhythm
US Central (America/Chicago) • All-time
Peak: 11 PMOvernight: 35
Badge & Data
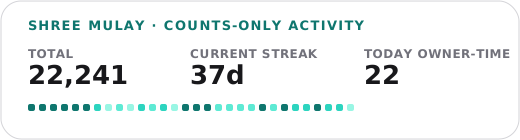
Embed a live counts-only activity badge or pull the public heatmap JSON for your own tooling.
Markdown
Data API
curl https://shreemulay.com/api/heatmapPrivacy: counts only — no repo names, messages, or branches are exposed.
Color Scale
Tower and heatmap colors come from your own activity. Activity levels are calculated dynamically using the 25th/50th/75th percentiles of your non-zero days, recalculated live to highlight meaningful contribution days.
Level 0
0
Level 1
1 - 6
Level 2
7 - 8
Level 3
9 - 10
Level 4
11+